TrainHeroic | Dashboard
A software platform for strength and conditioning coaches and athletes alike.
-
Goals
Provide coaches with a way to easily review activity in their account, increasing product value and MAU.
-
Team
Ben Crookston Founder & Product Owner
Kelli Fox Sr. Product Designer
-
Outcomes
Increase in in-app communication
Increase in MAU
Problem
Through initial interviews and feedback from current and prospective coaches, we suspected that coaches needed a way to easily locate important information within their account, specifically around athlete activity and associated coaching tasks. We also learned through feedback from trials that without a clear landing page, coaches in a trial found the app difficult to navigate and weren’t sure where to begin.
We narrowed this feedback to 2 primary JTBD:
As a coach with limited time, I need a way to quickly understand what happened and what needs attention, so that I can quickly carry out my coaching tasks.
Help me make better coaching decisions based on data
Help me view trends on KPIs
As a new user, I need a welcoming landing page, which helps me understand what TrainHeroic does and where to begin, so that I can maximize by 14-day free trial.
For our initial designs, we chose to focus exclusively on job #1.
With our initial feedback-based assumptions, we hypothesized that:
Coaches needed a central location (re: dashboard) to find necessary information in order to coach more efficiently
Coaches wanted to know when programming is low for an athlete or team
Coaches want to know when athlete analytics deviate from “normal” behaviors
Coaches wanted to know what has happened in terms of sessions logged, and to quickly check session summaries
Coaches were interested in financial/org stats to inform them of the health of their business
Coaches would find value in integrating billing
Process
We began our design process by synthesizing the initial feedback from interviews and onboarding training calls. From this feedback, we designed 2 low fidelity wireframes for A B testing which represented dashboard concepts.
WIREFRAMES
Wireframes were created in Sketch, and later uploaded to InVision for user testing.
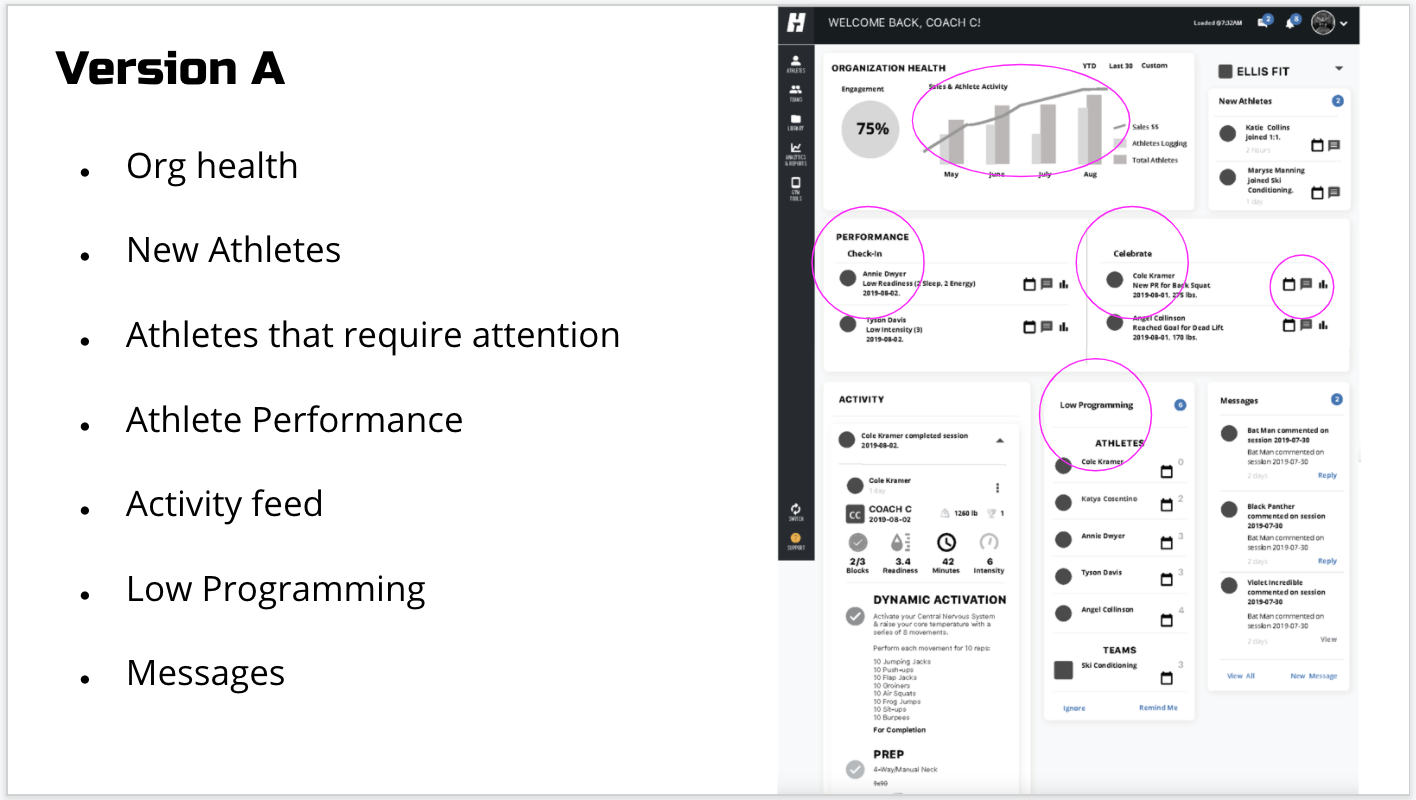
Organization health included compliance and business metrics, such as new sales. In alignment with new sales, we also included a ‘New Athlete’ section, allowing coaches to nurture new leads, with quick access to message or program a training session for the athlete.
Performance included actionable insight into athlete activity, including celebratory metrics, ‘Celebrate,’ and metrics that were cause for concern, ‘Check In.’ Celebratory actions included things like personal records, goals met, or compliance streaks. Check in’s indicated metrics in need of intervention, like low readiness scores, or missed sessions. With each athlete surfaced, we provided a call to action messaging and calendar buttons.
A/B USER TESTING
We conducted A/B testing with 5 current users. The users were selected based on a range of personas, including tactical coach, general population coach, youth/sport coach, and competitive athlete coach. We used a scripted interview, beginning with generalized questions to better understand each coaches individual process and JTBD. Each interview was roughly 1 hour, conducted remotely over screen share and recorded. We used Calendly to schedule interviews, and JoinMe and Zoom for screen sharing and recording.
SYNTHESIZING FINDINGS
From the culmination of feedback from all 5 users, we identified some common themes:
Request for navigating between an athlete-specific dash vs general dash
Need for “Red Flags,” to call out metrics that need attention
Request for color-codes to quickly indicate urgency (found elsewhere in the platform)
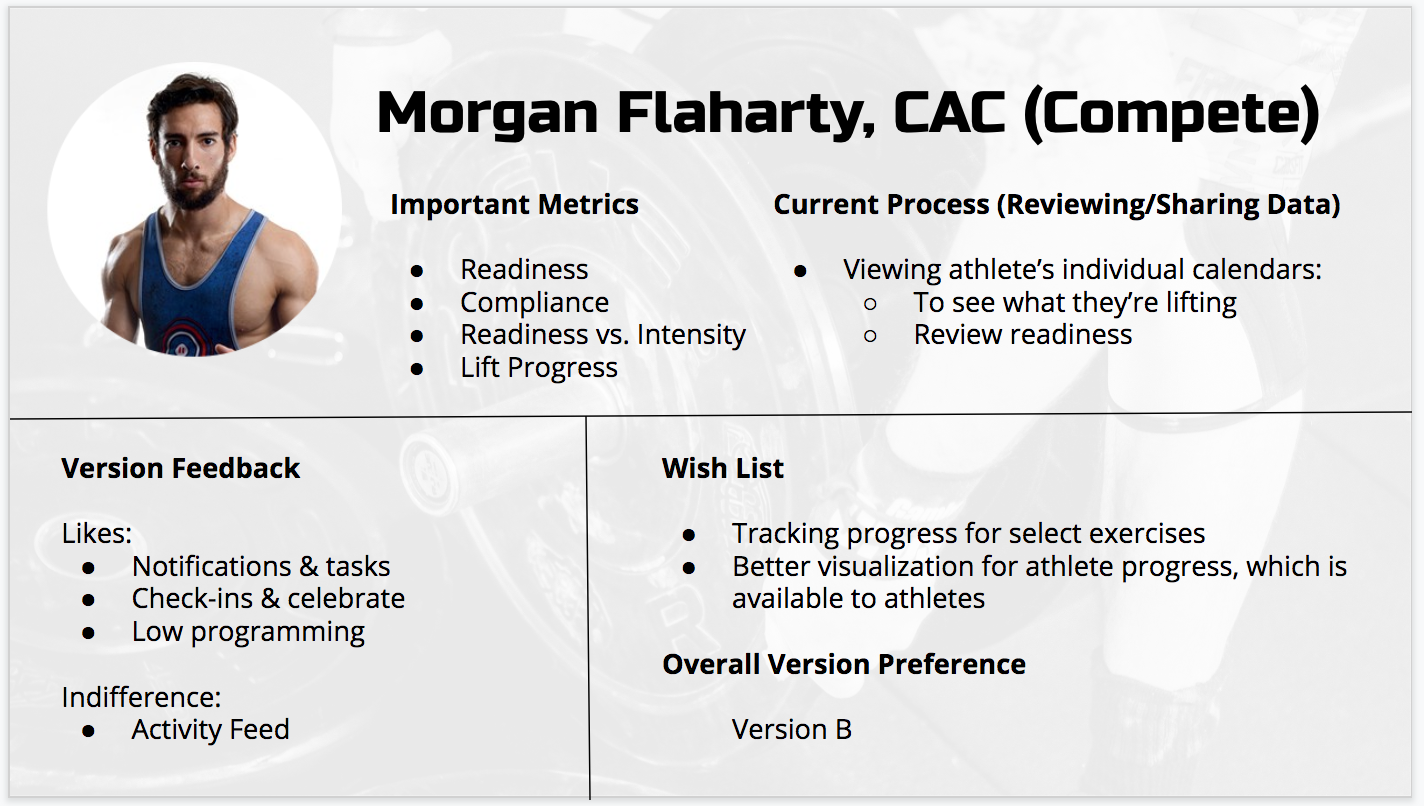
Compliance and readiness ranked as important metrics throughout
Key benchmarks might vary by athlete
Ability to view feedback over time, versus just daily
Current process involves viewing athlete’s 1:1 calendar for training feedback
Current use of Excel to create graphs and synthesize training feedback
Need to share progress with athletes or stakeholders (with visual representation)
Managing financials is NOT a current pain point
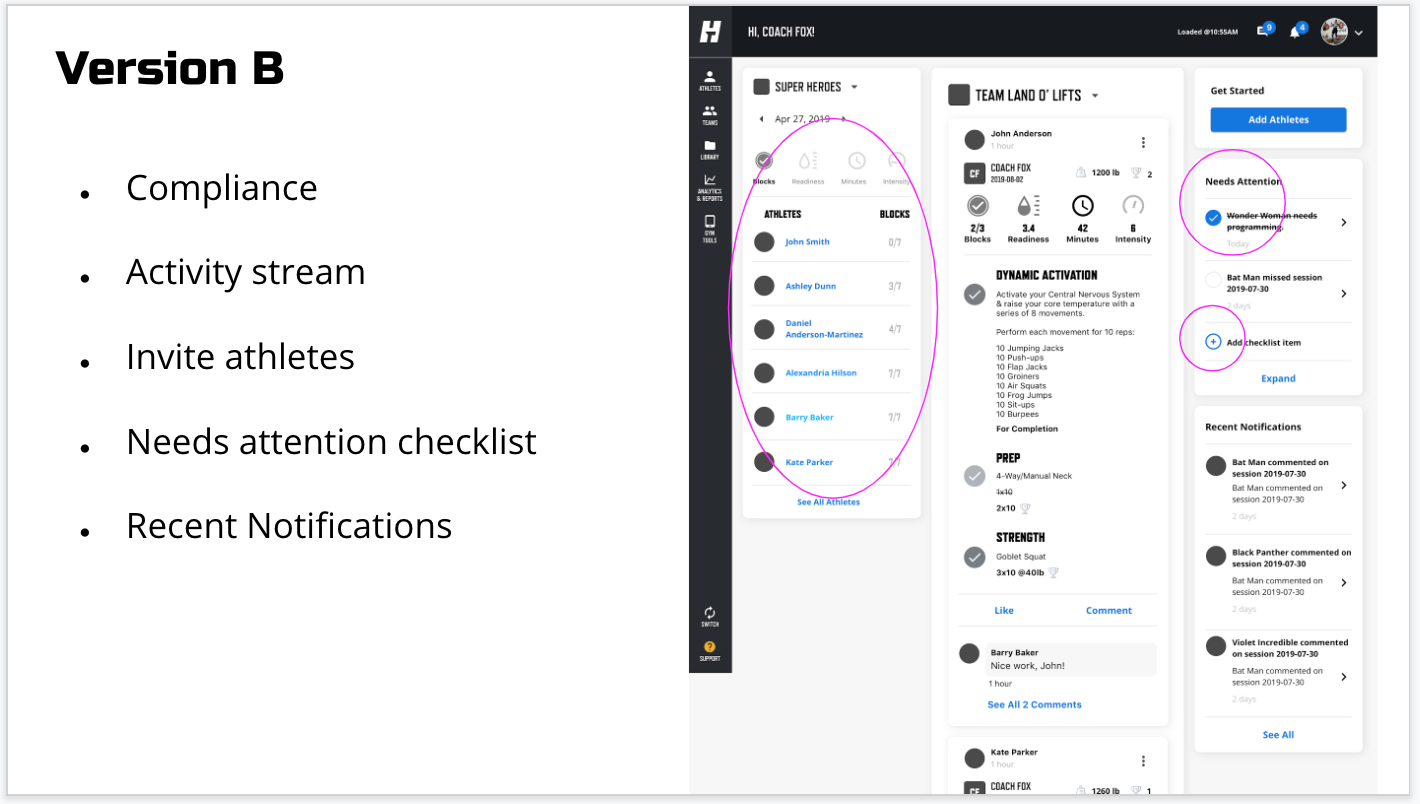
Version A resonated with team coaches, and version B resonated with 1:1 coaches;
The findings from user testing validated many of our initial assumptions, however we were surprised to find that for these particular coaches, integrated billing and overall business metrics were NOT important.
Overall, 2/5 users preferred version A, while 3/5 users preferred version B. These preferences were largely based on the athlete versus team-centric differentiators between both versions. While we were aware of this distinction between both versions, we did not initially anticipate how polarizing that would prove.
My Role
I was responsible for:
Documenting and curating initial feedback from user interviews and onboardings to surface to our Product Team
Sourcing and scheduling interview across different coach personas (5 users)
Including proving contextual information and requesting permissions prior to the interview as well as following up after the interview
Creating the Version A wireframe in Sketch
Version B was created by our lead designer, Kelli Fox
Facilitating interviews with 5 coaches alongside our lead designer and moderator, including note-taking, technical support, as well as questioning
Synthesizing findings from interviews and documenting findings to share with stakeholders
TOOLS
Sketch, InVision, Join.me.
Retro
While we discovered that users found the same metrics important, like compliance and low programming, we realized that we were trying to serve 2 different user types on top of each persona:
Coaches who primarily focus on team or group coaching
Coaches who identify as personal trainers, who focus primarily on individual athletes
At the time of our research, we were ultimately trying to serve too broad of a user base, and have since redirected our focus to commercial coaches coaching in a group-specific setting. Since defining our new personas (which exclude tactical and academic coaches), we’ve introduced KPIs, like new trials and sales into the dashboard.
While our interview findings lead to the insight that coaches were fairly neutral toward business metrics, we ultimately felt that this was an area of opportunity for a our future target market, commercial coaches, and included business metrics in future iterations.


